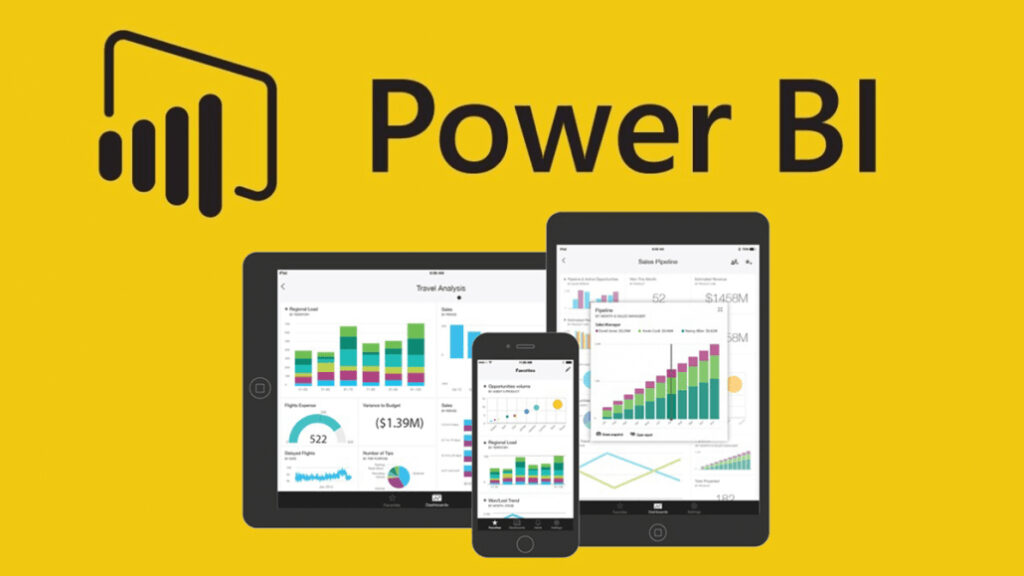
In today’s data-driven world, businesses are constantly seeking ways to transform raw data into valuable insights. Power BI, a powerful business intelligence tool developed by Microsoft, has emerged as a leading solution for data visualization, analytics, and reporting. In this article, we will explore what Power BI is, its core features, and when a business should consider using it to unlock the power of their data.
Understanding Power BI: Empowering Data Analysis
Power BI is a suite of business analytics tools that enables organizations to analyze data and share insights in a visually appealing and interactive manner. It encompasses various components, including Power BI Desktop, Power BI Service (cloud-based service), and Power BI Mobile (for mobile devices). Together, these components provide end-to-end capabilities for data preparation, data modeling, visualization, and collaboration.
Key Features of Power BI
- Data Connectivity: Power BI offers a wide range of connectors that allow businesses to connect to various data sources, including databases, spreadsheets, online services, and cloud platforms. This connectivity enables businesses to consolidate data from different sources into a single dashboard for analysis and reporting.
- Data Preparation and Modeling: Power BI provides robust data preparation and modeling capabilities. Users can transform and shape data using the Power Query Editor, which allows for data cleansing, transformation, and combining multiple data sources. With the Power Pivot data modeling feature, businesses can establish relationships between tables, define calculations, and create hierarchies.
- Interactive Visualizations: One of the standout features of Power BI is its ability to create interactive and visually appealing dashboards and reports. With a wide range of customizable visualizations such as charts, graphs, maps, and tables, users can represent their data in a meaningful and engaging way. These visualizations provide insights at a glance and enable users to explore data from different angles.
- Natural Language Querying: Power BI incorporates natural language processing capabilities, allowing users to query and analyze data using plain English. This feature makes it easier for non-technical users to interact with data and obtain answers to their questions without having to write complex queries or formulas.
- Collaboration and Sharing: Power BI facilitates collaboration and sharing of insights across an organization. Users can publish their dashboards and reports to the Power BI Service, where they can be securely shared with colleagues and stakeholders. The service also enables real-time collaboration, allowing multiple users to work on the same report simultaneously.
When Should a Business Use Power BI?
Power BI is a versatile tool that can benefit businesses across various industries and functions. Here are some scenarios where Power BI can be particularly valuable:
- Data Exploration and Analysis: When a business has large volumes of data and wants to gain insights and identify trends, Power BI can be a game-changer. With its interactive visualizations, users can explore and analyze data from multiple sources, identify patterns, and make data-driven decisions quickly.
- Reporting and Dashboarding: Power BI is an excellent choice for businesses that need to create visually appealing and interactive reports and dashboards. Whether it’s sales performance, financial analysis, or operational metrics, Power BI provides the flexibility to create comprehensive and informative visualizations that can be easily shared with stakeholders.
- Data Consolidation and Integration: If a business has data spread across different systems and sources, Power BI can help consolidate and integrate that data into a single view. By connecting to various data sources and leveraging the data transformation capabilities of Power Query, businesses can create a unified view of their data, enabling cross-functional analysis and reporting.
- Self-Service Analytics: Power BI is designed to empower self-service analytics, enabling business users to perform their own data analysis without relying on IT or data professionals. With its intuitive interface and natural language querying, Power BI allows users to explore data, create custom calculations, and derive insights without the need for specialized technical skills.
- Real-Time Monitoring: For businesses that require real-time monitoring of their key performance indicators (KPIs) or metrics, Power BI offers real-time data streaming capabilities. With Power BI’s ability to connect to real-time data sources such as Azure Stream Analytics, businesses can monitor critical metrics and react promptly to changes and trends.
- Mobile Analytics: In an increasingly mobile-driven world, Power BI Mobile provides businesses with the ability to access and interact with their data on the go. With Power BI Mobile, users can view dashboards, reports, and KPIs on their mobile devices, ensuring that insights are readily available wherever they are.
Conclusion
Power BI is a powerful business intelligence tool that empowers organizations to harness the power of their data. With its comprehensive features for data connectivity, preparation, modeling, visualization, and collaboration, Power BI enables businesses to gain valuable insights and make data-driven decisions. Whether it’s exploring data, creating interactive reports, or monitoring key metrics, Power BI provides the flexibility and agility needed to meet the analytical needs of businesses across various industries. By leveraging Power BI, businesses can unleash the potential of their data and drive success in today’s data-centric business landscape.