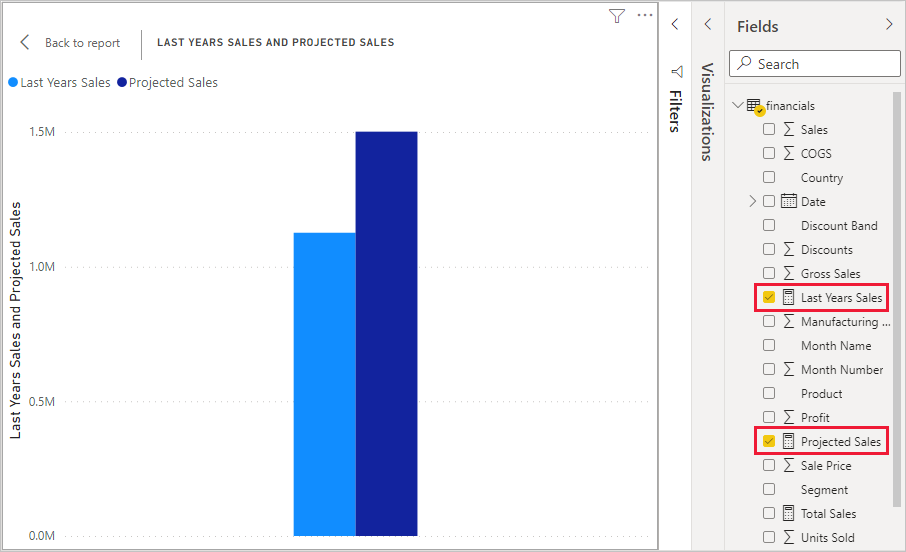
In the world of business intelligence and data analytics, Power BI has emerged as a powerful tool for data visualization and reporting. With its user-friendly interface and extensive capabilities, Power BI has become a go-to solution for many organizations seeking to derive insights from their data. When working with Power BI, you’ll often come across two essential components: measures and calculated columns. While they may seem similar at first glance, they serve different purposes and have distinct characteristics. In this article, we’ll delve into the differences between measures and calculated columns in Power BI, exploring their unique functionalities and when to use each one.
Measures: Unleashing the Power of Aggregation
Measures are a fundamental concept in Power BI. They are calculations that perform aggregations, calculations, or summarizations on your data. Measures are typically used to perform calculations on numerical or quantitative data, such as sums, averages, counts, or percentages. By defining measures, you can derive valuable insights and answer specific business questions.
One of the key advantages of measures is that they are evaluated at query time. When you interact with your Power BI report, such as applying filters or drilling down into data, the measures recalculate dynamically to reflect the changes. This dynamic nature allows for real-time analysis and enables users to explore data from different angles.
To create a measure in Power BI, you use a formula language called Data Analysis Expressions (DAX). DAX provides a rich set of functions and operators to define complex calculations. For example, you can create a measure to calculate the total sales for a given period or the average revenue per customer.
Additionally, measures can be added to tables, matrixes, charts, and other visualizations in your Power BI report. They act as the foundation for generating meaningful visualizations, enabling you to communicate insights effectively.
Calculated Columns: Expanding the Data Model
Calculated columns, on the other hand, are another type of calculation available in Power BI. Unlike measures, calculated columns are computed during the data loading process and become part of the underlying data model. They add new columns to your dataset based on the defined calculations.
Calculated columns are particularly useful when you need to perform calculations that involve relationships between tables or when you require additional columns to filter or slice your data. For instance, you can create a calculated column to determine the profitability of a product by subtracting ist cost from the sales price.
However, it’s important to note that calculated columns have some limitations. Since they are computed during data loading, they can impact the performance and memory consumption of your Power BI model, especially when dealing with large datasets. Additionally, calculated columns are not dynamic and do not adjust to user interactions like measures do. They are fixed values based on the data available during the data loading process.
When to Use Measures and Calculated Columns
Understanding when to use measures and calculated columns is crucial to effectively leveraging the power of Power BI. Here are some guidelines to help you make the right choice:
- Aggregation and summarization: If your calculation involves aggregating or summarizing data, such as calculating totals, averages, or percentages, measures are the way to go. They provide dynamic calculations that adjust based on user interactions, making them suitable for interactive reports.
- Row-level calculations: If your calculation requires evaluating data at the row level or involves complex logic that depends on relationships between tables, calculated columns are more appropriate. They can be used to add new columns to your dataset, enabling filtering and slicing based on the computed values.
- Performance considerations: When dealing with large datasets or complex calculations, it’s important to consider the impact on performance and memory consumption. Measures are typically more efficient in terms of performance since they are evaluated at query time. Calculated columns, on the other hand, can increase the model size and loading times.
- Flexibility and interactivity: If you need your calculations to dynamically respond to user interactions, such as applying filters or drilling down into data, measures are the preferred choice. Calculated columns provide fixed values that are computed during data loading and do not adjust based on user actions.
In summary, measures and calculated columns serve distinct purposes in Power BI. Measures are used for aggregating and summarizing data, providing dynamic calculations that adjust based on user interactions. On the other hand, calculated columns are computed during data loading and expand the data model by adding new columns based on defined calculations. Choosing between measures and calculated columns depends on the specific requirements of your analysis, the nature of your calculations, and the performance considerations.
Harnessing the capabilities of Power BI, including measures and calculated columns, empowers organizations to unlock valuable insights from their data, enabling data-driven decision-making and facilitating business growth.